The Benchmark Reports tab (Reports > Benchmark Reports) displays the results of scheduled benchmark jobs. In Cloudhouse Guardian (Guardian), scheduling a benchmark job lets you compare the configuration of nodes in your environment to a set of criteria standardized by the Center for Internet Security (CIS). For more information, see Benchmarks.
Once a benchmark job has been scheduled and a scan has been completed, the results can be found on the Benchmark Reports tab.
Accessing a Report
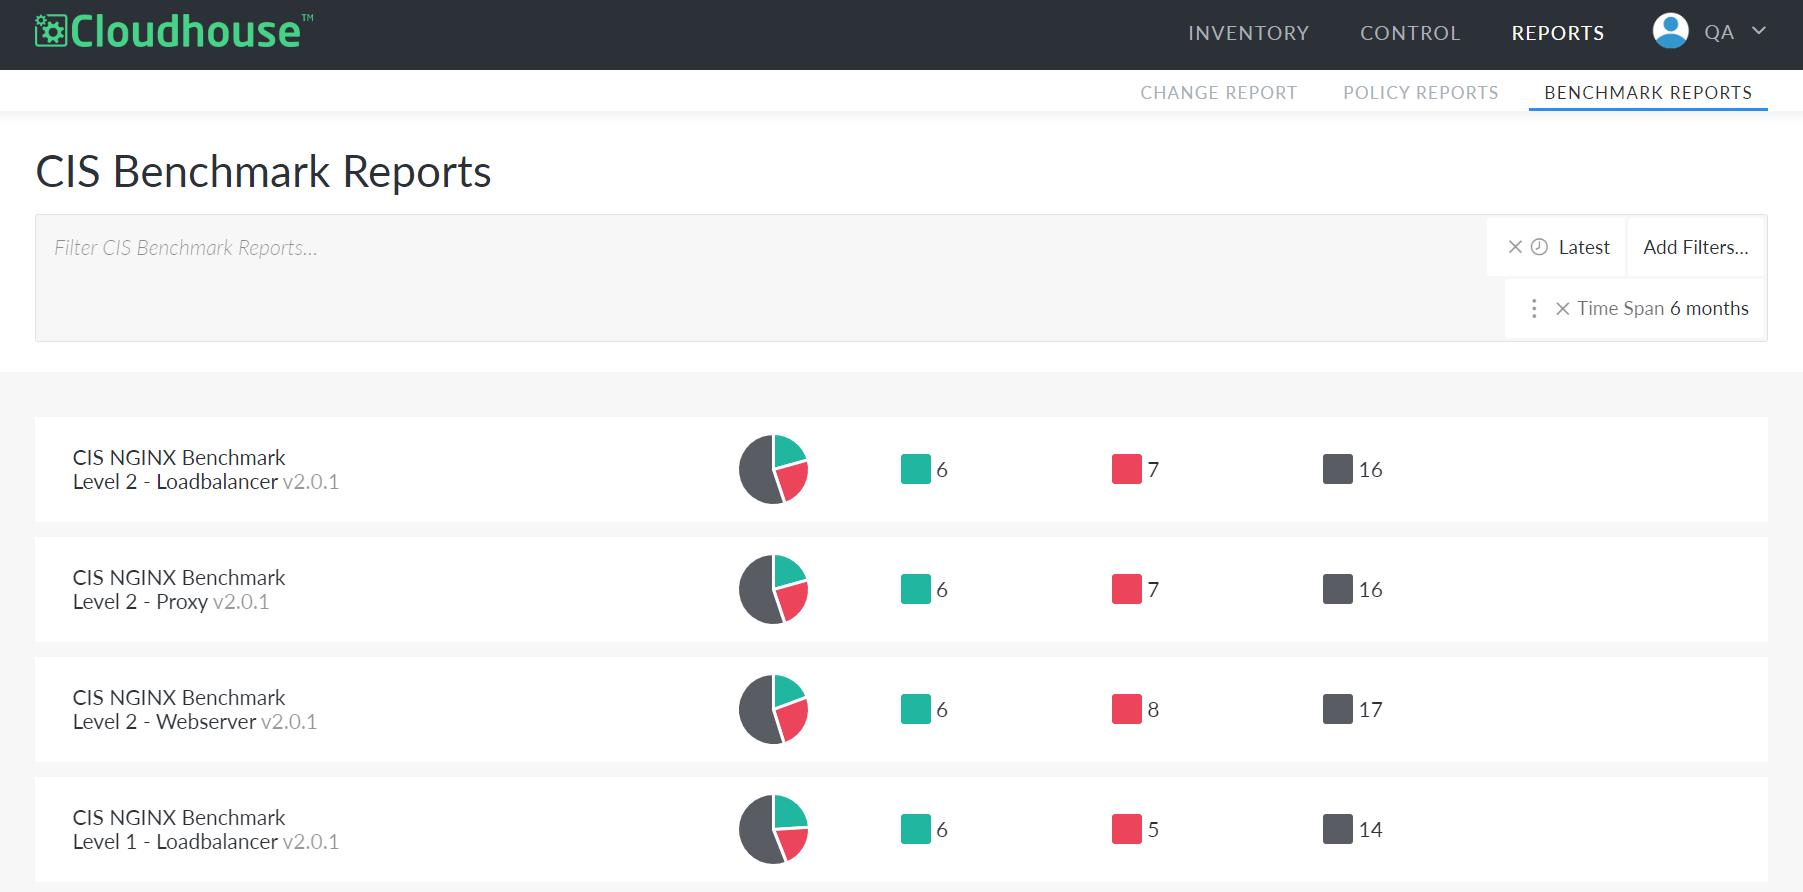
The Benchmark Reports tab displays an overview for each report. These report overviews include a breakdown of the number of 'Passing', 'Failing', and 'Error' results in each of the following categories:
|
Category |
Description |
|---|---|
| Passing |
Indicates that a node has met all requirements for a given check. |
| Failing |
Indicates that a node did not pass a given check. |
| Error |
Indicates a permissions issue on the node being scanned. |
| Ignored |
Indicates that a given check was skipped as part of the benchmark. Each benchmark can have different levels, and each level might check for certain things. For example, the CIS NGINX Benchmark Level 1 might ignore checks the CIS NGINX Benchmark Level 2 doesn't. If you think checks are being ignored when they shouldn't be, ensure you've selected the proper level benchmark. |
To view a report in more detail, click a report overview.
Note: By default, the Benchmark Reports tab shows reports that have results within the last week. If you don't see any reports, or if you can't find the report you're looking for, try updating the Latest and Time Span filters at the top of the page. For more information, see Report Options.
Benchmarks are made up of several different metrics, more commonly called checks, that determine whether a node is compliant with the set requirements. A benchmark report displays each check along with a breakdown of 'Passing', 'Failing', 'Ignored', or 'Error' results. The Benchmark Compliance pie chart in the top left of the page displays the ration of 'Passing', 'Failing', 'Ignored', and 'Error' results within the scan, whereas the bar graph shows scan results over time.
To view more information on a specific check, click the check to open a drop-down displaying more details. Here, you can find information on what the check is looking for in each node, why the check is important, and how to solve any issues if a node has failed the check.
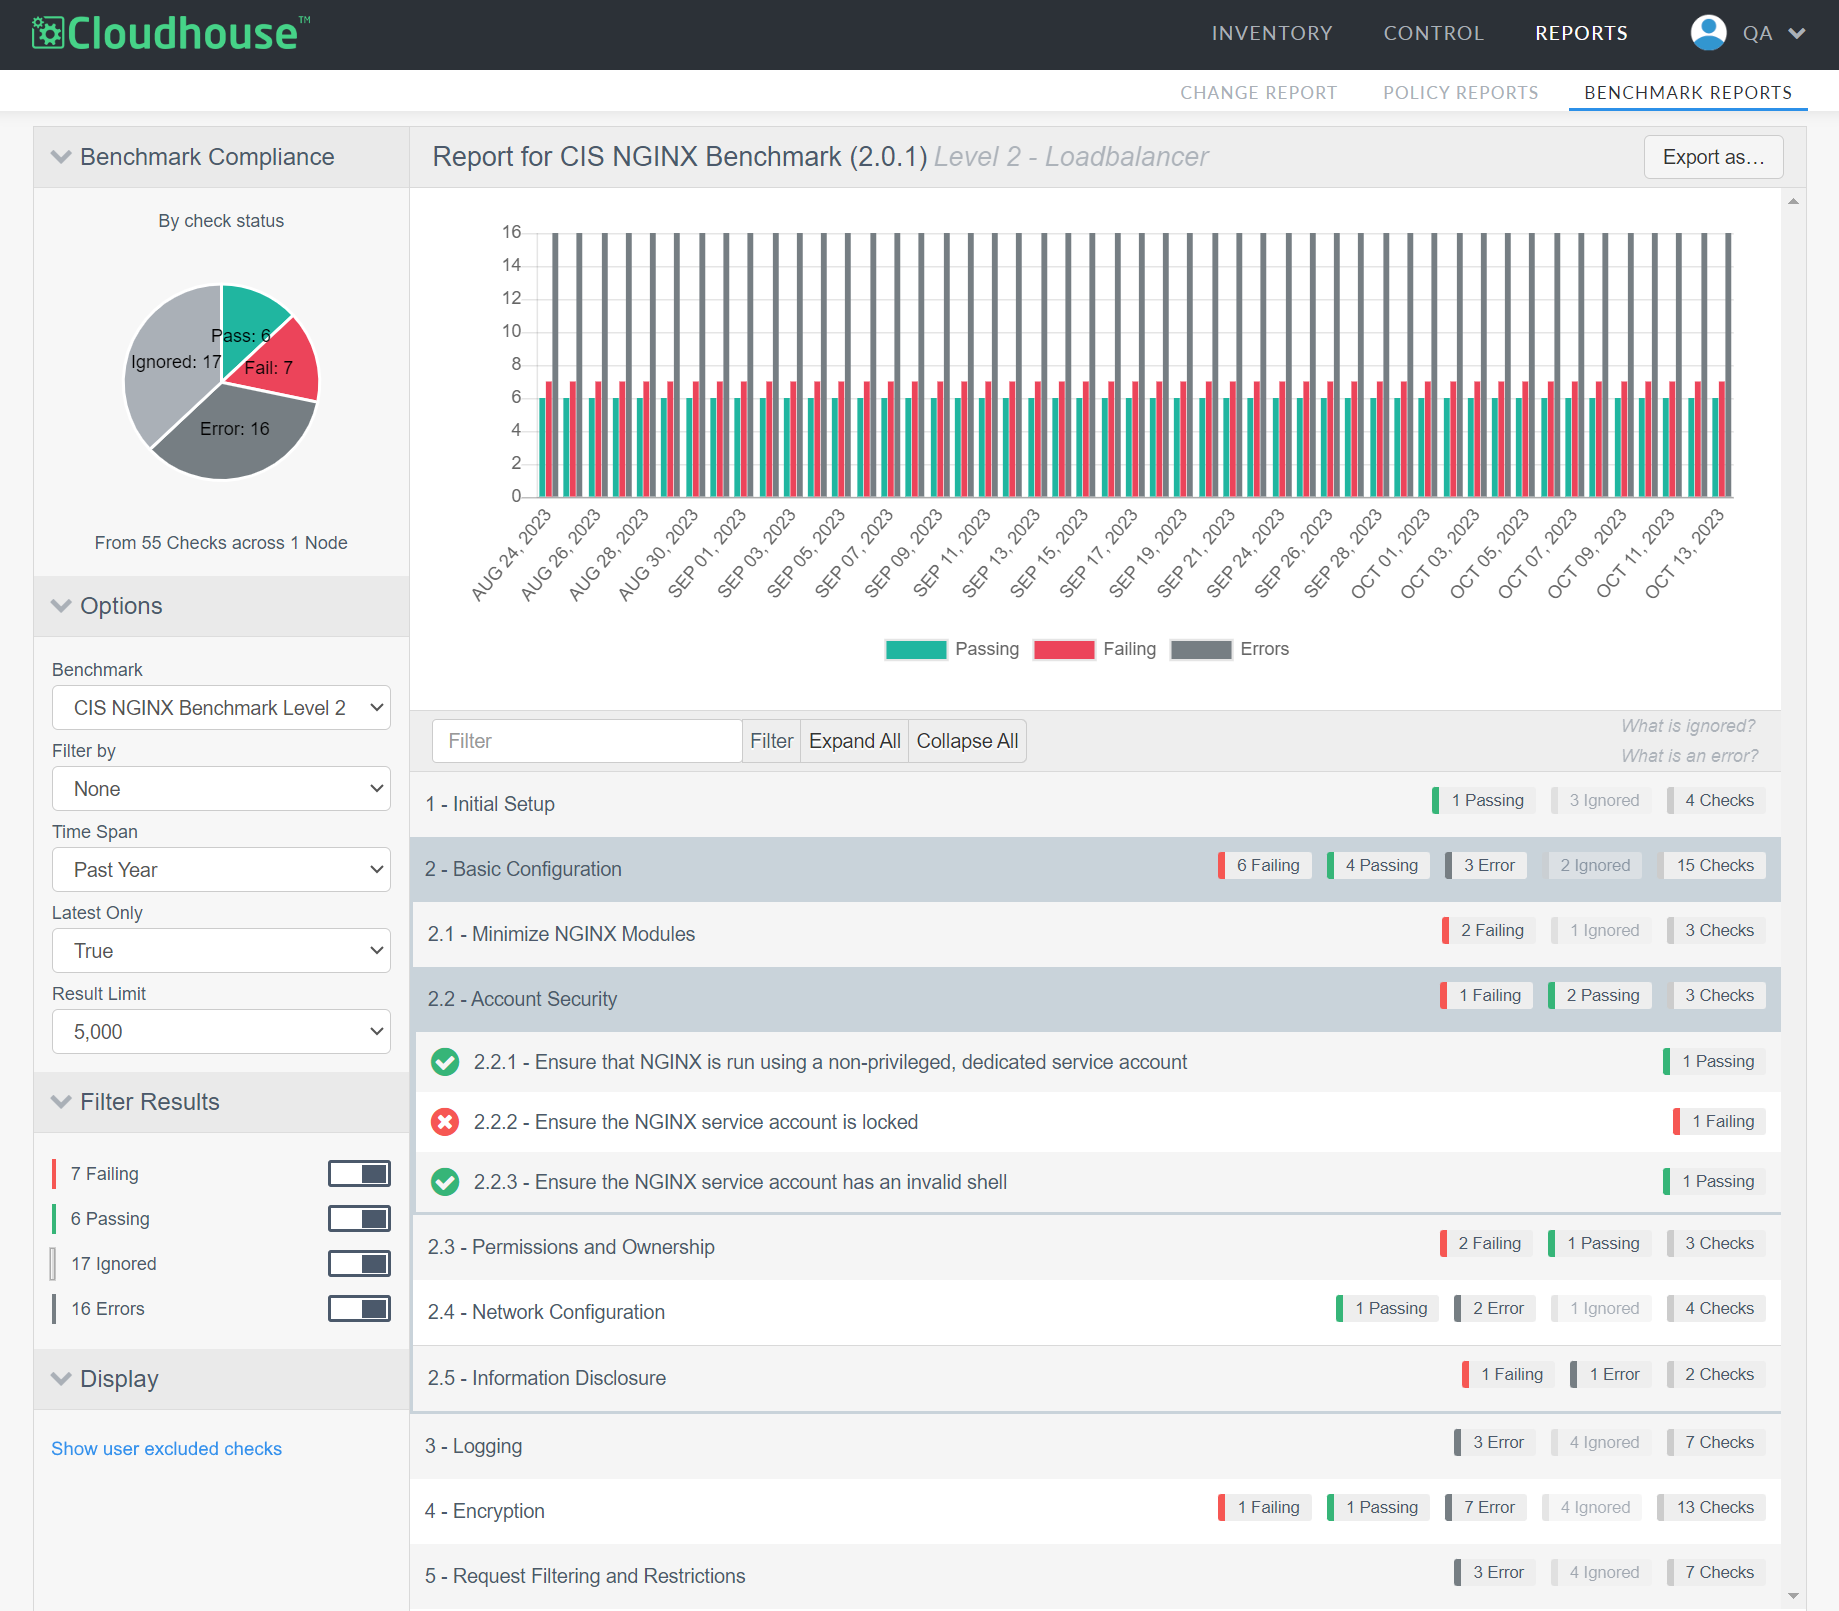
Report Options
When viewing a report, you have several Options on the left of the page to customize how the data is displayed.
Here, the following options are displayed:
| Option | Description |
|---|---|
| Benchmark drop-down list |
The benchmarks that have been run. The options displayed in this list represent every benchmark that has been scheduled as a job in your Guardian instance. Select a benchmark to display the corresponding report. By default, this option is set to the benchmark selected on the previous page. |
| Filter By drop-down list |
Designates the systems to include in the report. Select the drop-down list to display the following options:
By default, this option is set to 'None'. |
| Time Span drop-down list |
Designates the reporting period. Select the drop-down list to display the following options:
By default, this option is set to the time span selected on the previous page. |
| Latest Only drop-down list |
Designates whether only the results of the latest scan are displayed. If 'True', only the results of the latest scan are displayed in the report, regardless of the selected Time Span. If 'False', all scan results for the selected Time Span are displayed in the report. By default, this option is set to 'True' if the Latest filter was applied on the previous page. If the Latest filter was not applied on the previous page, this option is set to 'False'. |
| Result Limit drop-down |
Designates the maximum number of results shown in the report. Select the drop-down list to display the following options:
By default, this option is set to '5,000'. |
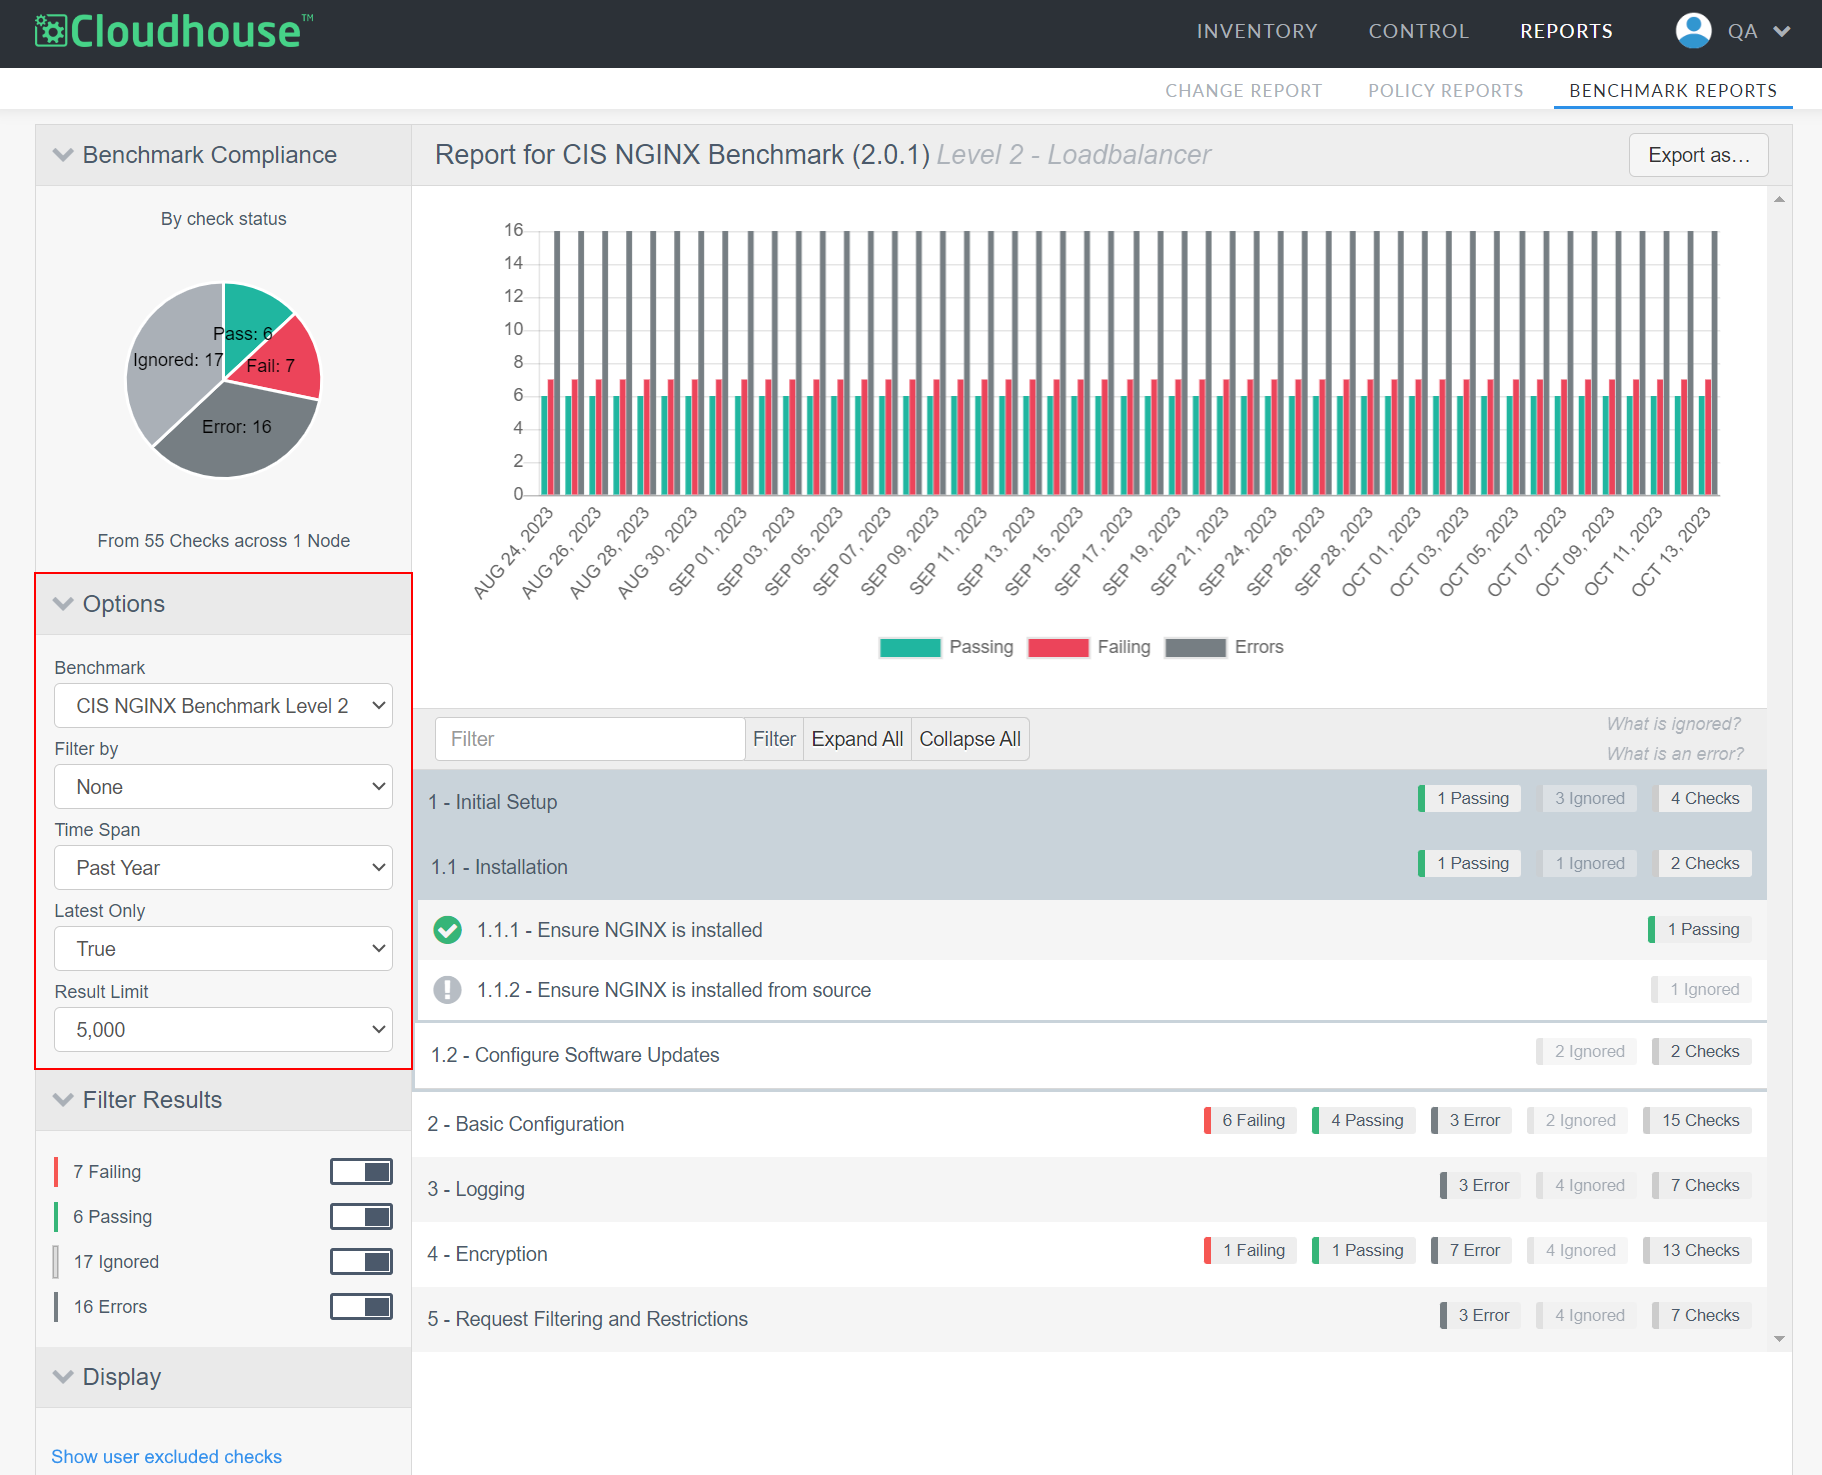
Filter Results
While Report Options are useful for filtering the output of a report, filtering the results of a report can be especially useful for troubleshooting. The Filter Results drop-down lets you display or hide 'Failing,' 'Passing,' 'Ignored,' and 'Error' results.

Here, the following options are displayed:
| Filter | Description |
|---|---|
| Failing toggle |
Designates whether to filter via 'Failing' results. If selected, the 'Failing' checks are displayed in the report's output. A node might fail a check for various reasons. To view specific details including the failing node and how to address it, find the failed check in the report and click Show check results. |
| Passing toggle |
Designates whether to filter via 'Passing' results. If selected, the 'Passing' checks are displayed in the report's output. |
| Ignored toggle |
Designates whether to filter via 'Ignored' results. If selected, the 'Ignored' checks are displayed in the report's output. Each benchmark can have different levels, and each level might check for certain things. For example, the CIS NGINX Benchmark Level 1 might ignore checks the CIS NGINX Benchmark Level 2 doesn't. If you think checks are being ignored when they shouldn't be, ensure you've selected the proper level benchmark. |
| Errors toggle |
Designates whether to filter via 'Error' results. If selected, the 'Error' checks are displayed in the report's output. An Error result most likely indicates a permissions issue on the node being scanned. However, you find the specific reason for any errors by referring to the specific check. For more information on viewing check details, see Accessing a Report. |
Note: In some cases, organizations will block certain checks from being run. These checks are considered excluded. To display excluded checks, click Show user excluded checks in the Display drop-down below Filter Results. For more information on how to exclude a check, see Exclude a Benchmark Check from a Node Group.
Export a Report
If you want to share a report with someone who is not a Guardian user, you can do so by exporting the report. Reports can be exported in either a CSV or PDF file format.
To export a report, complete the following process:
-
Click Export as... in the top right corner of the page.
-
Select a CSV or PDF file format.
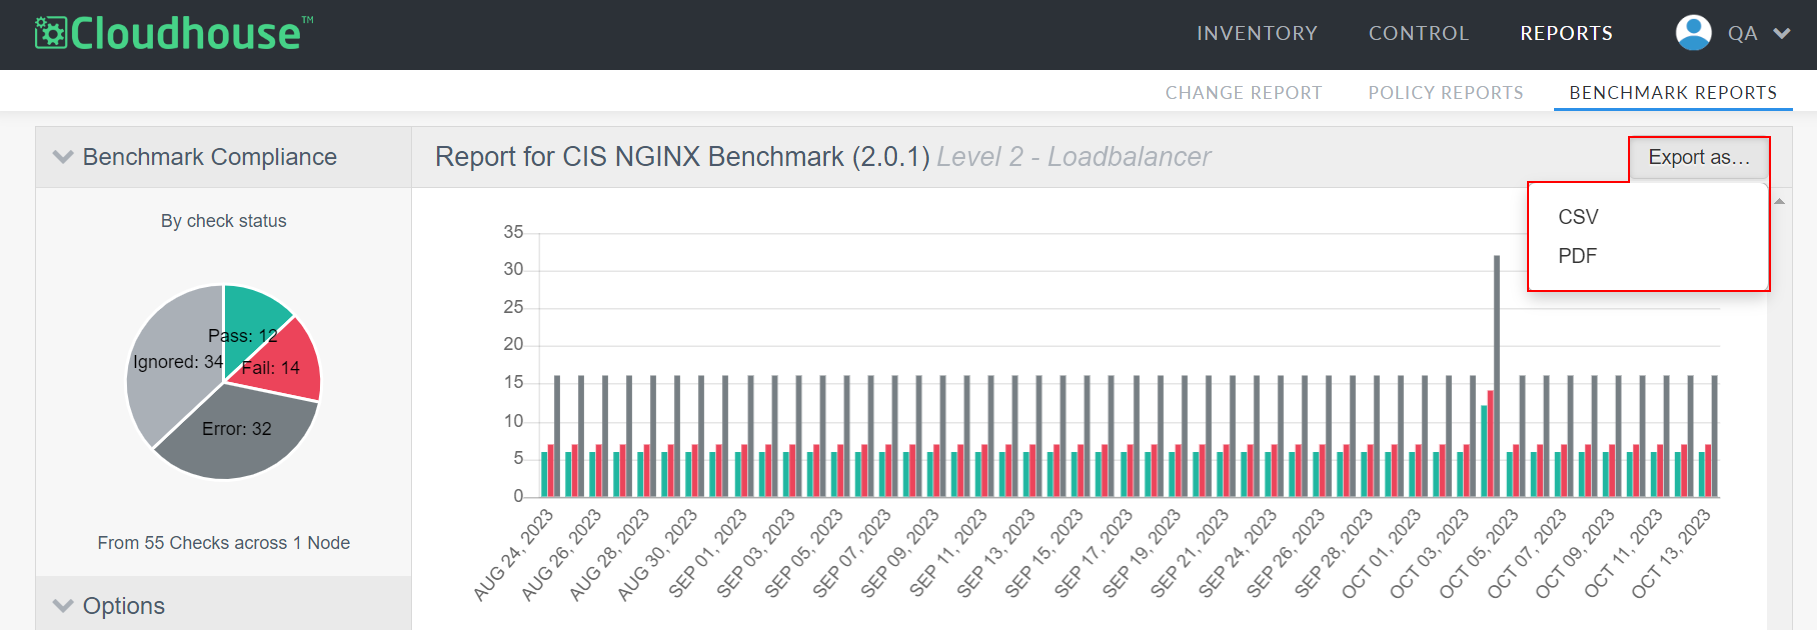
Once you've selected a file format, you can find the report wherever your device stores downloads.